Paperform Forms Study 2020: Data Analysis
Last updated January 2020
Aim: to gain insights on the impact of general form structure on respondent behaviour/responsiveness, and to share those insights with our Paperform audience (primarily for use in our Form Design eBook). We have found there to be a gap in available, quality research into the impact of pagination and number of questions used in forms and their subsequent response rates.
Contents:
- Methodology: determining general sample data
-
Queries (query, parameters, finding, and summaries + future
study (insights):
- Is there a negative correlation between the quantity of question fields used on forms and completion rates?
- What kind of impact does the quantity of pages on a form have on completion rates?
- Limitations
1. Methodology: Determining General Sample Data
The general sample data for this study consists of Qualified Forms. Forms were considered to be "Qualified Forms" if they met the requirements listed below. Requirements were then translated into a query, and communicated to Tech, who then retrieved and exported raw data programmatically from existing user data.
Personal user information was not extracted, and any unique identifiers for forms were encrypted. Data is therefore not traceable by form ID, accounts, or any other unique identifier. This means the same sample data set cannot be extracted from our servers again, and is therefore not reproducible.
This general sample data was then further explored for findings relevant to the Design eBook. Claims made in the eBook that were difficult to verify with existing research were noted, and queries were formed to test those claims. Specific parameters were then formulated and applied to the data in Google Sheets to extract relevant findings from the general sample data. Those findings were then considered alongside the qualitative experience of conversations with over 8000 users, before final conclusions were drawn.
Requirements & Parameters for "Qualified Forms":
-
Must include respondent activity in rich detail, specifically:
- Show submission start and completion rates
- Show pagination
- Show question information, including quantity used
-
Must be recent/relevant data that reflects current trends
(within the last 12 months)
- Data for the first requirement is only accessible/stored for 30 days, therefore data must be from the last 30 days.
- Must have > 20 submissions. The median number of form submissions for forms that i) received >0 submissions, and ii) were actively used in the last 30 days, was 17. (total 13,500 forms surveyed on the 20/01/2020). Submission numbers greater than 20 will allow a buffer that ensures the sample data accurately represents active form use.
Findings & Data
Query: How many forms in the last 30 days (20 Dec 19 - 20 Jan 19) have submissions > 20? = 4172
- Raw data with an initial sample data size of 4127 forms: https://docs.google.com/spreadsheets/d/1dI02PSDTqMbWmo8Bmh5jkKEq9QtgKY7w-5d5fexFUt0/edit#gid=0
-
Removed inaccurate data:
- Forms with <1 question field
- Forms returning a completion rate >100% (due to Total Started not being accurate)
- Total sample data size of 4040 qualified forms
2. Queries for General Sample Data
Claim #1: the more questions on a form, the lower the completion rate (cognitive friction theory)
Query: Is there a negative correlation between the quantity of question fields used on forms and completion rates?
Parameters
- Total started / Total Completed * 100 = (new column) Completion Rate %
-
Subsets of data grouped by # questions per form:
- If >/=50 forms exist for any given # of questions, then they are grouped together (forms with 1 to 19 questions)
-
If <50 forms exist for any given # of questions, then
ranges will be formed as follows:
- 20-29
- 30-39
- 40-49
- 50-99
- 100-199
- 200-299
- 313 (single form)
- 355 (single form)
- As we've removed the outliers from the sample data and refined subsets of data by number of questions, drawing on averages for findings will give us the best insights into the correlation between the number of questions by form and completion rates.
Findings
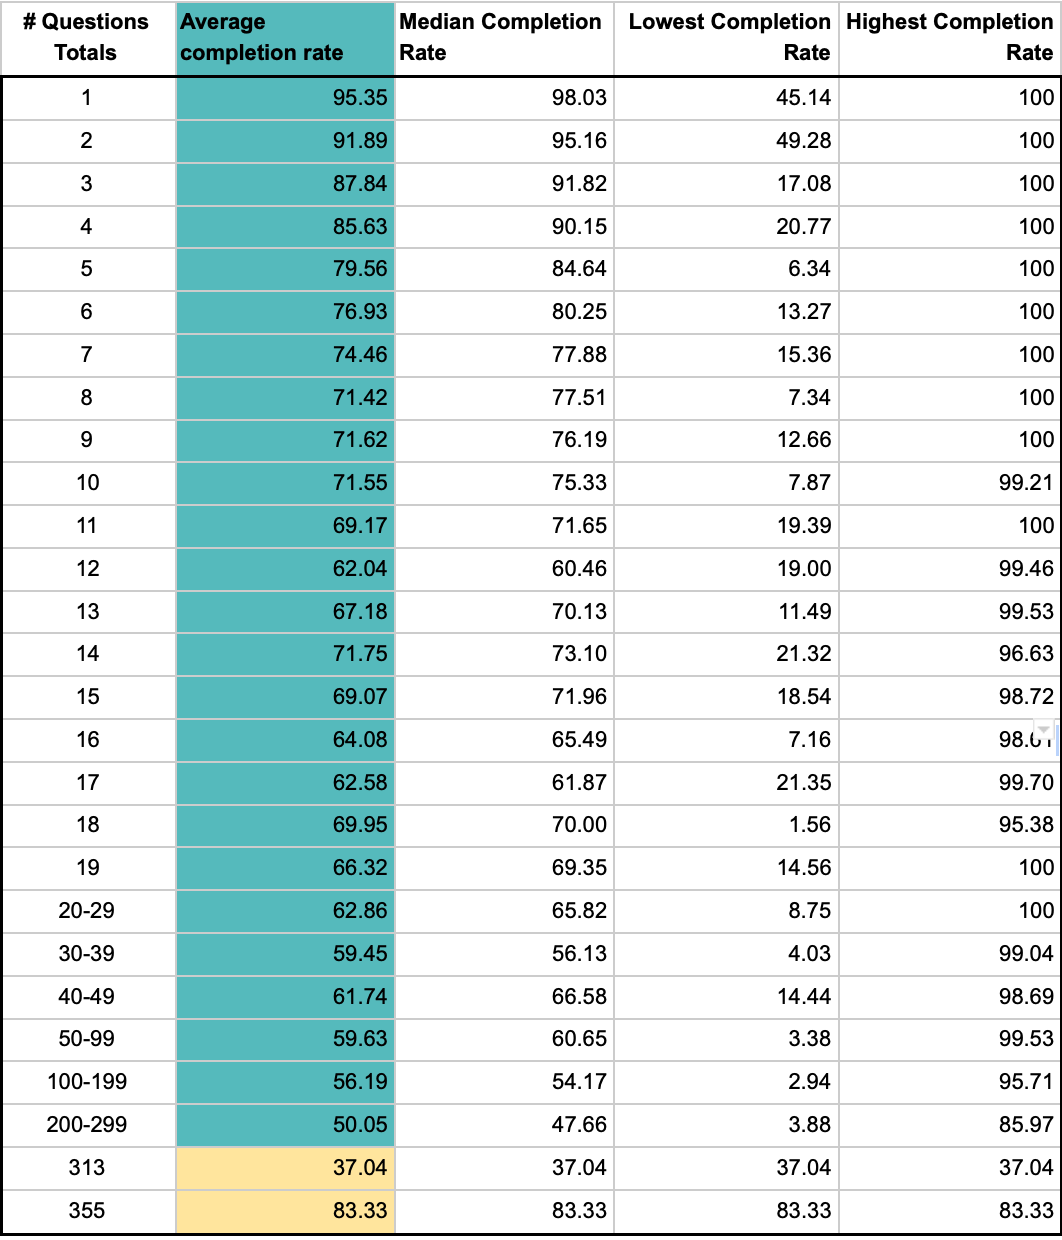
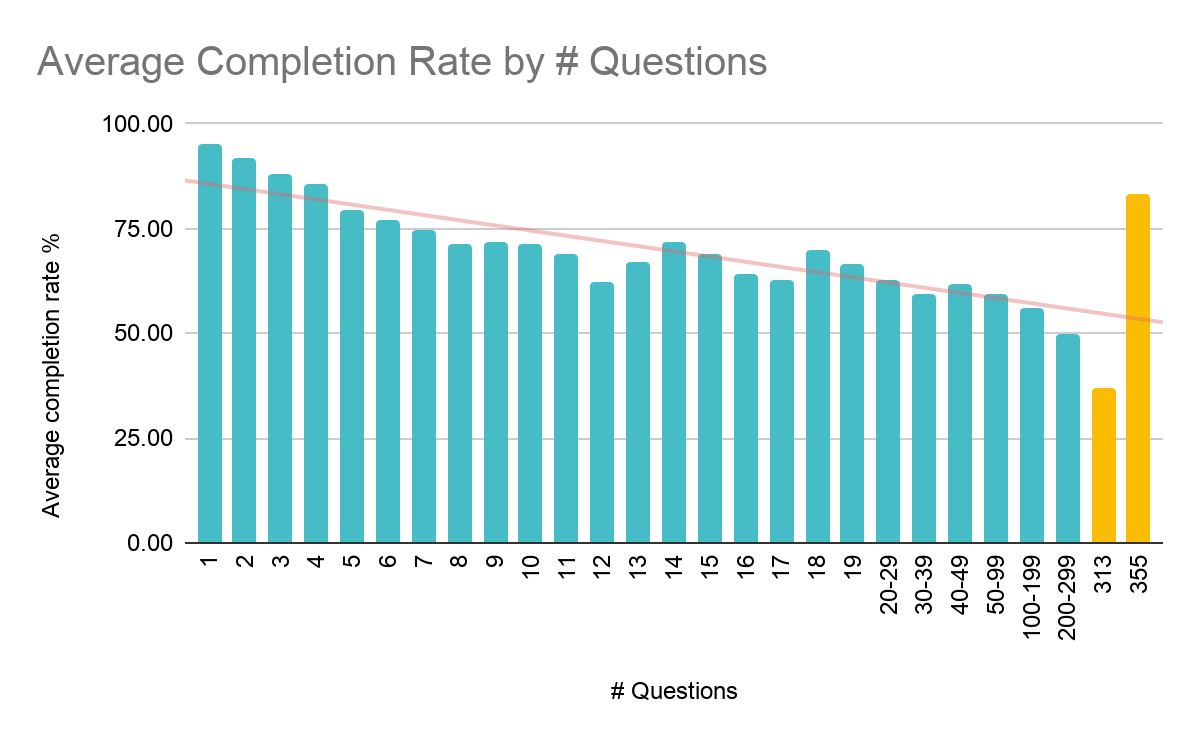
Generally, there is a negative correlation between the number of question fields and completion rates. Overall, average completion rates see a progressive downtrend as the total number of form questions increase. However, the results also reveal fluctuations in completion rates that are worth noting:
- There is a steady, progressive decline of completion rates for forms with 1-8 questions (overall decline of 23.93%). This is the most significant steady decline we see in completion rates across the results.
- The trend subsequently sees a general, fluctuating decline for forms with between 8-99 questions (overall decline of 11.79%). Further, the downward trend slows by half the rate of that seen for forms with 1-8 questions.
- We see a sharp decline with forms that have more than 100 questions (decline of 9.58%) across three groups.
- There are two notable outliers - two single forms with question numbers of 313 and 355. One produced a notably low completion rate (37.04%), while the other produced a high completion rate given the number of questions (83.33).
Summary
Generally speaking, the higher the number of questions on a form, the lower the completion rate. However, taken in isolation, this reductionist perspective fails to highlight nuances in respondent behaviour that provide helpful insights into better form creation.
The results reveal three key sub-trends which, together with our experience working with users, allow us to presume the following:
-
The number of questions on a form does not dictate completion
rates alone. The use-case and purpose of forms are also key
factors. It's likely here that forms with 1-8 questions represent
a very particular set of use-cases, such as surveys, lead
generation, and simple eCommerce forms, hence a dominant sub-trend
appearing.
A second sub-trend becomes present for forms with between 8-99 questions, which also likely represents different use-cases. We start to see fluctuations across this second sub-trend: forms with greater quantities of questions return higher completion rates than those with lower quantities. As the downward trend slows by half compared to the first sub-trend, the incentive for respondents to complete these forms appears to be, on average, greater.
A third sub-trend of steady decline can be seen for forms with 100 or more questions. It's likely that there is less incentive to complete these forms than for forms which belong to the second sub-trend. The cognitive friction created by more than 100 questions, likely means the incentive driving respondents to completion needs to be extremely strong. - The outliers provide a good example of how two forms with extremely high question numbers can produce varying results: it serves as an example of how high completion rates can indeed be achieved for forms with extremely high question numbers.
While form completion rates generally see a decline due to higher quantities of questions, the number of questions on a form alone does not determine completion rates. Rather, it is one key factor that should be considered when creating a form. Purpose and incentive, as well as use-case also must be taken into consideration. It is possible to create longer forms that return a high completion rate, although it does present a greater challenge.
Future research: To examine the relationship between completion rates and the average number of questions used on a form within predominant use-cases (and by extension industries, where possible).
Claim #2: pagination increases completion rates
Query: what kind of impact does the quantity of pages on a form have on completion rates?
Parameters
- Total started / Total Completed * 100 = (new column) Completion Rate %
-
Subsets of data grouped by quantity of pages per form:
- If >/=50 forms exist for any given # of pages, then they are grouped together (1-5 pages)
-
If <50 forms exist for any given # of pages, then ranges
will be formed as follows:
- 6 - 10 pages
- 11+ pages
- As there is a broad range of data and as outliers have been included, findings will be based on median results. The median is resistant (not affected) by outliers, and therefore more reliable than averages in this case.
Findings
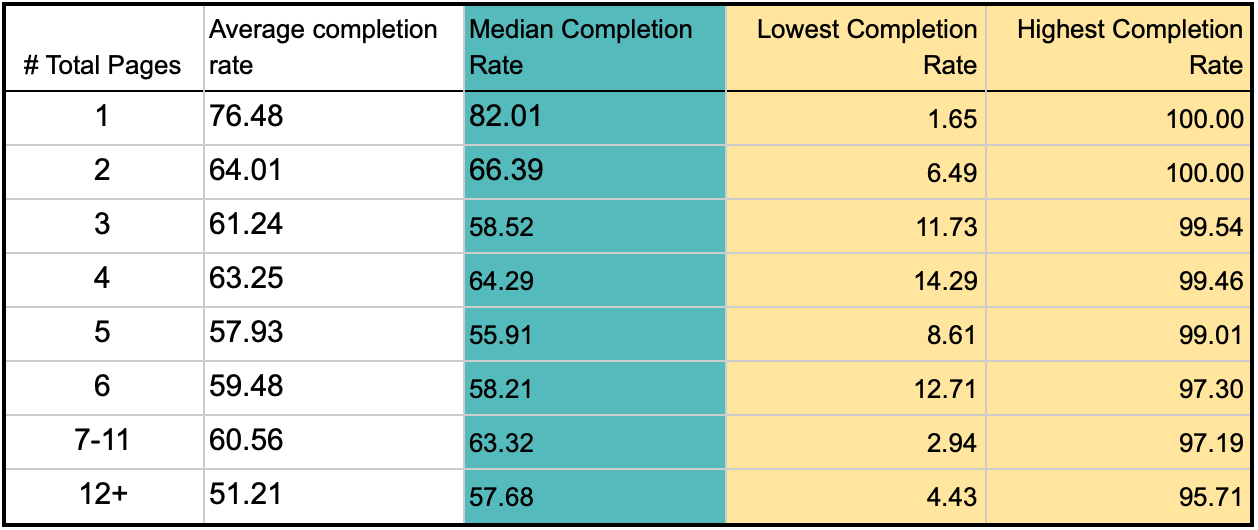
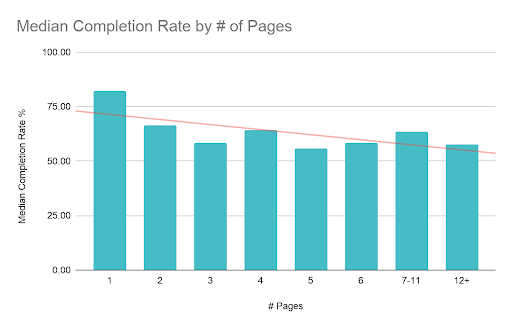
There is an overall downward trend which shows a negative correlation between page numbers and completion rates. The following results should also be noted:
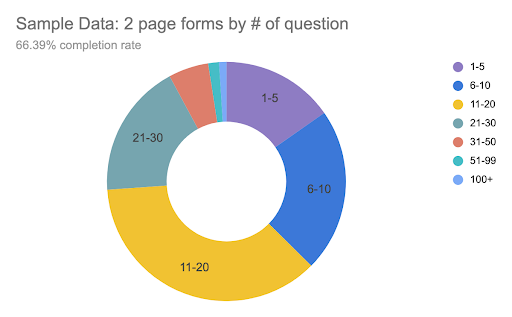
- Non multi-page forms (1 Page) had the highest median completion rate at 82.01%, a rate 15.62% greater than the highest performing multi-paged group (2 pages 66.39%).
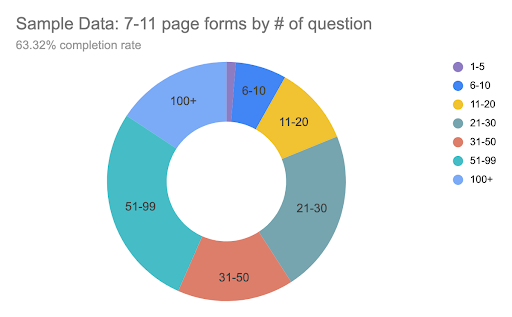
- Looking at multi-page forms in isolation, the downward trend is significantly less evident, and we see greater fluctuation in completion rates. Forms with two pages return the highest results at 66.39%, and forms with five pages the lowest at 55.91%. Forms with more than seven pages returned higher rates than forms with three pages, etc.
Summary
Single page forms performed significantly better than forms with multiple pages, returning a completion rate approximately 15% higher than the best performing multi-paged form group (2 pages). We considered that these results could be indicative of the impact of question numbers (forms with more pages are potentially likely to have more questions, which create cognitive friction, and therefore negatively impact completion rates), however we would then also expect to see a steady and progressive downward trend as page numbers increased, which is not the case.
A breakdown of these groups by number of questions is revealing; for example, while forms with 2 pages and 7-11 pages returned similar completion rates (3% difference), the sample set of each revealed divergent groups when segmented by number of questions:
The fluctuation in completion rates for paginated forms across the groups indicates that, where a form has multiple pages, the number of pages has a low impact on completion rates (single page forms clearly outperform multi-page). As previously discussed with questions quantities, incentive to complete and purpose for engaging likely have a greater impact on completion rates than pagination alone.
By extension, use-case will likely have an impact on completion rates, as respondents will have set expectations which influence their management of cognitive friction. For example, a simple lead generation form should expect low completion rates if it contains many pages, however a law firm client intake form with more than four pages should expect higher completion rates.
Future Research:
- Explore respondents' behaviour in response to pagination for specific use-cases and by industry.
- Further explore the relationship between question numbers and pagination within the context of completion rates.
Research Limitations:
This is a macro study which explores trends across large samples of data across a broad spectrum of use-cases and industries. It would benefit from being considered alongside use-case examples and A/B testing where available.