
Are you new to Google Analytics and feeling overwhelmed by all the metrics and reports? You're not alone! Many people struggle to understand the platform and make sense of the data it provides.
In this blog post, we'll provide a brief introduction to Google Analytics (GA) and explain some of the key concepts you need to know to get started. We'll also provide some tips on how to navigate the platform and make the most of its features.
By the end of this post, you should have a better understanding of how Google Analytics can help you track and analyze your website traffic, and how to use the data it provides to improve your online presence. Let's dive in!
First, what is Google Analytics?
Google Analytics is a free platform offered by Google that allows you to track and analyze the traffic on your website. With Google Analytics, you can see how many people are visiting your website, where they are coming from, and which pages on your website are the most popular.
It provides a wide range of metrics and reports that can help you understand your website's performance and identify areas for improvement.
This includes everything from how long visitors are spending on your website, to which pages they are visiting the most, to keeping track of the actions they're taking, such as making a purchase or reading a blog, and much more.
Google Analytics is a valuable tool for anyone who wants to track and improve the performance of their website. It provides a wealth of data and insights that can help you understand your website's audience and make data-driven decisions to improve your online presence.
How do you set up Google Analytics?
Before we jump into how to use Google Analytics, first let's cover how to set it up.
 (Image via Google Analytics)
- Go to the Google Analytics website (https://analytics.google.com/) and click on the "Sign In" button in the top right corner.
- Sign in with your Google account. If you don't have a Google account, you can create one for free by clicking on the "Create account" button.
- Click on the "Admin" button in the bottom left corner of the page.
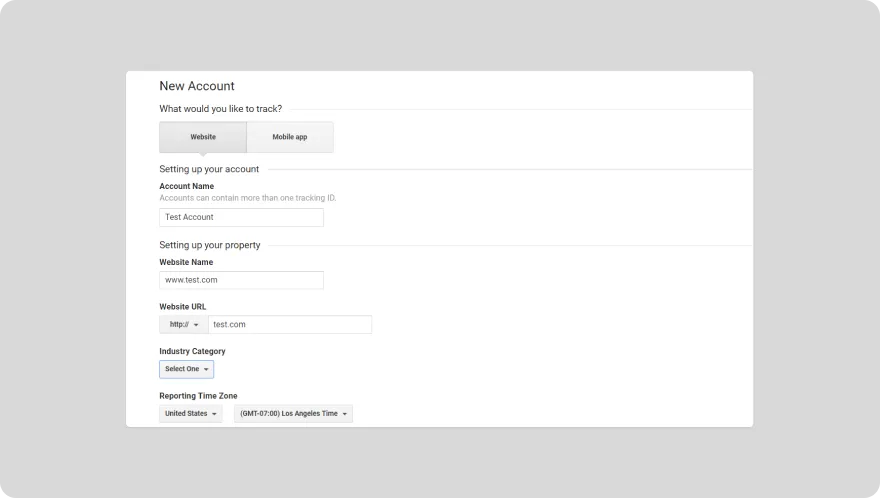
- In the "Property" column, click on the "Create Property" button.
- Enter a name for your website and select the website's industry category and time zone. Then, click on the "Create" button.
- You will be taken to a page with your tracking code. This code is unique to your website and is used to track and collect data about your website traffic.
- Copy the tracking code and paste it into the section of your website's HTML code.
- Save your changes and publish your website.
- Go back to the Google Analytics website and click on the "Tracking Code" tab.
- Verify that the tracking code is working properly by clicking on the "Send Test Traffic" button.
- Once you've verified that the tracking code is working, you can start using Google Analytics to track and analyze your website traffic. You can access your data by clicking on the "Reporting" tab in the top navigation bar.
That's it! You've successfully set up Google Analytics for your website. You can now use it to track and analyze your website traffic and improve your online presence.
💡 Tip: You’ll need to add your tracking ID to the code of every page you want to track. After you’ve done that you’re ready to rock and roll!
Setting goals in Google Analytics
Once you've installed GA, it's time to set up goals. This is important as it allows you to track specific actions that users take on your website.
Goals can be anything from completing a purchase or filling out a contact form, to subscribing to your newsletter or watching a video.
By setting goals, you can see how well your website is performing in terms of achieving these specific actions and how well your website is meeting your business objectives.
For example, if a user completes a purchase on your website, you can assign a dollar value to that action and see how much revenue your website is generating. This can be especially useful for e-commerce websites, as it allows you to see which products or pages on your website are the most profitable.
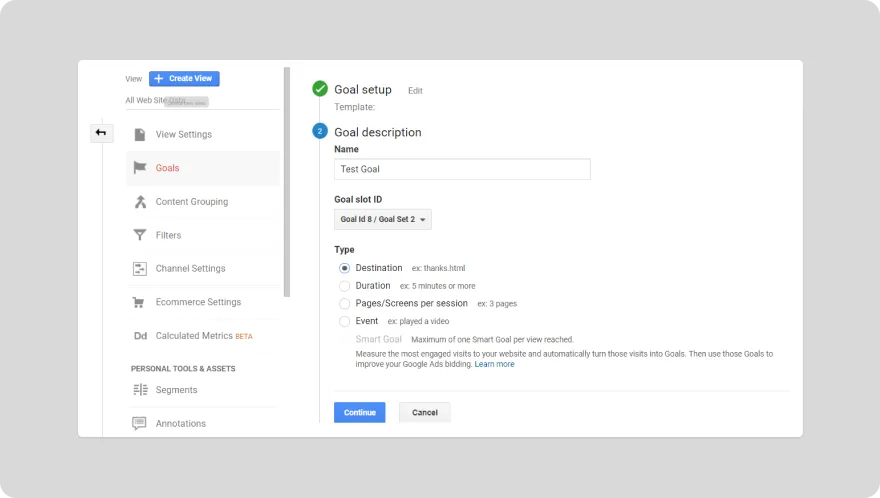
To create a goal, simply click on the ‘Admin’ button on the bottom left hand corner of the page. From here, select the ‘Goals’ menu and click on ‘+ New Goal’ to get started. Set the parameters for your goal based on what you’re trying to track:
 (Image via Google Analytics)
There are four types of goals available for you to choose from:
- Destination: When you want a page view to be counted as a conversion.
- Duration: When you want a certain amount of time spent on a page to be counted as a conversion.
- Pages/Screens per session: When you want a certain number of pages viewed within a single session to be counted as a conversion.
- Event: When you want a certain event to be counted as a conversion, such as a button click or download.
The drawbacks of tracking in Google Analytics
While setting up goals seems relatively straightforward, there are some slightly annoying aspects of conversion tracking that Google Analytics should not be used for alone.
For example, if you’re hoping to track the conversions on an online form - whether you run an online store or are simply wanting to track the submissions on an online contact, application or lead capture form, Google Analytics might not be the best option available.
[TEMPLATE: lead-capture-form]
For one, you would have to create a dedicated goal for each separate form, as well as an accompanying thank you page to redirect your form respondents to, which could get very tedious.
A faster way to do this would be to create a form using an online form builder. The benefit of doing this is that form builders are tailor-made to solve such issues.
With Paperform, once you create a form to embed to your website, you can then connect the form to Google Analytics. Paperform will then send through data to your Google Analytics account and automatically track the following actions:
- When a form is successfully completed and submitted: This can be especially useful when you’re creating an online store as it will help you track exactly how many orders have been sent through.
- When a user starts filling out a form: If a user started a form, completed it partially and then left, you’ll still be able to collect this data with Paperform and reach out to them directly if you wish.
- When a user reaches the checkout stage: Again, extremely useful if you run an ecommerce store. You can also easily target these users with abandoned shopping cart emails to turn high-intent customers into converting customers.
→ How to set up Paperform and Google Analytics
Google Analytics dashboard: An overview
 (Image via Google Analytics)
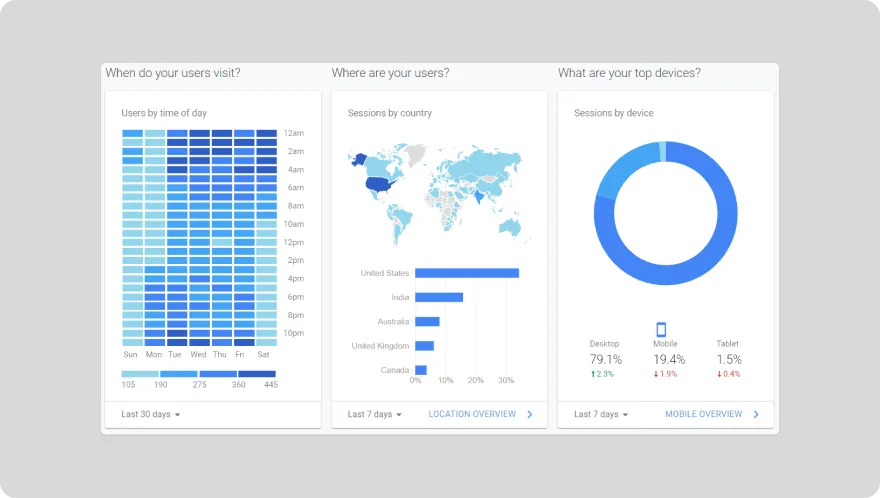
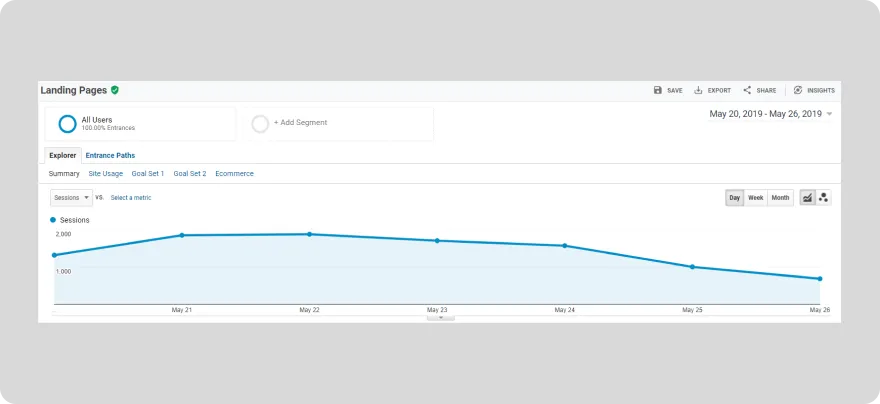
Your dashboard gives you a comprehensive overview of your website or page’s performance within parameters established by you.
By default, it is set to a 30-day window, although you can change this to a 12 month period if you want a more macro perspective, or even a 24 hour window if, for example, you want to see how many hits were generated from a recent PPC campaign.
The Reports menu on the left-hand side of the dashboard gives you access to more detailed reporting. Let’s take a look at the areas covered and the insights which can be gleaned from them.
[CTA]
1. Audience Report
 (Image via Google Analytics)
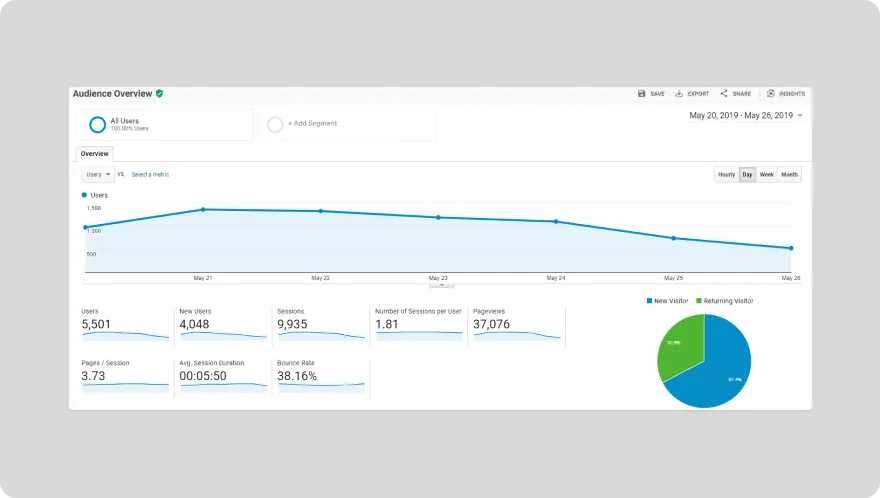
Your audience overview gives you comprehensive insights into who’s accessing your website. Click on it and you’ll see charts that represent the following data:
| Data | Description |
|---|---|
| Total sessions | Your reach. The amount of visits you’re getting. An increase will show in green while a drop will show in red. |
| Total users | How many individual users are accessing your website. |
| Pageviews | How many page views per visit. Are users jumping off after spending time on one page or do they move around your site architecture. |
| Ave. pages per session | How many pages do readers view on average? |
| Ave. session duration | Lower times don’t necessarily mean poor performance. It can merely speak to your website’s efficient UX and UI. |
| Bounce rate | High bounce rates can point to problems in your back end. Long page load times are a common reason for high bounce rate. |
| New vs returning | An increase in new traffic usually means your social or content campaigns are working. |
| Geo | Find out where in the world users access your website from. |
2. Acquisition Report
 (Image via Google Analytics)
It’s always important to know where your users are coming from. This can tell if your co-branding venture is paying off, whether the influencers or bloggers you’ve reached out to with are linking back to you or whether your social campaigns are effective.
The acquisition reports show whether users came to you through:
| Data | Description |
|---|---|
| Direct hits | The viewers typed your URL into their search bar and came to you directly. |
| Organic | They found you by clicking a link on a SERP related to keywords associated with your business |
| Referral | A click from a link on a blog post or another website is a referral. |
| Social | Users came to your website by following a link on social media. |
3. Behaviour Report
 (Image via Google Analytics)
Behaviour reports provide an insight into how users behave on your website. It’s a great way to determine what content is working and what isn’t.
Here you can see your top performing pages, best performing landing pages and most common exit pages (where users jump off). Keep in mind that exit pages are completely unrelated to bounce rate.
You can’t expect users to stay on your website forever but it’s important to ensure they’re jumping off where you want them to.
By checking out the “user flow” report, you can gain insight into how users navigate through your website and this can inform changes you make to your UX strategy.
4. Device Report
You can even determine whether users access your site most commonly through a desktop computer, mobile phone or tablet. This can provide insights into what kind of content best suits their consumption.
Longform written content is not necessarily the best way to go if 85% of your users access your site through a smartphone.
[NEWSLETTER]
Unlock more insights with Google Analytics
By following the steps outlined in this blog post, you can set up Google Analytics and start using it to gain valuable insights into your website's performance.
By connecting Google Analytics to Paperform, you can get even more insights into form performance and see how well your form, landing page, or online storefront is contributing to your business objectives.
We hope this blog post has helped you understand the basics of Google Analytics and how to use it to track and analyse your web traffic. If you have any questions or need additional help, please don't hesitate to get in touch.