Paperform provides powerful tools to help you analyze and manage your form results effectively. Our Submissions Dashboard lets you gather insights on your respondents and package your findings in a customizable report.
In this guide, we’ll walk you through each tab of the Submissions Dashboard and show you how to leverage Paperform's built-in tools to maximize your results.
We’ll cover:
How submissions work — the difference between Partial Submissions and complete submissions
Viewing, filtering and managing submissions
Managing product stock from the Products Tab
Generating reports to leverage your data
Accessing analytics to gain insights into your respondent base
How submissions work
Paperform captures two types of submission on your forms:
Partial Submissions
Submissions
When a respondent begins to answer questions on your form, Paperform recognises this and starts to record their responses. These records are referred to as Partial Submissions.
When a user clicks on the Submit button at the end of your form, this record becomes a regular Submission.
Note: Partial Submissions require at least 5 seconds of inactivity after answering a question on your form.
Where to analyze your results
Paperform offers a handy dashboard to view and analyze your form results. Access your Submissions Dashboard by following our guide.
The different sections are broken down into:
Submissions
Partial Submissions
Products
Reports
Analytics
Submissions
Your form results
The Submissions table is where you will find all your form results. Each row on the table is one "submission" which contains one individual's response. A submission cannot be changed or modified once submitted.
Inside a submission, you'll typically find:
The submission ID.
The date & time the submission was sent.
The responses submitted on the form.
Records of scoring or payments processed. (Optional)
A default PDF summary of the submission.
Copies of any custom PDFs generated upon submission. (Optional)
Other metadata for the respondent if available (e.g. IP Address, Device Type).
Note: You will find Custom PDFs at the right most column of your submissions table.
Search, sort and filter your data
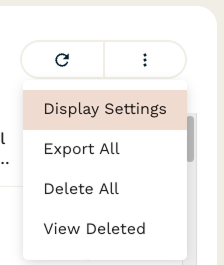
You have some flexibility over how your submissions table displays your results. Click on the three dots to access the table's Settings.
Display Settings
From here, you can:
Choose which question gets used as the "title" column.
Toggle which columns are displayed/hidden.
At the top of the submissions table, you will find:
A search bar to filter by keywords.
A date filter to show only submissions within a certain time period.
You can also sort your results by clicking on the table headers. The direction of the arrow indicates ascending or descending order.
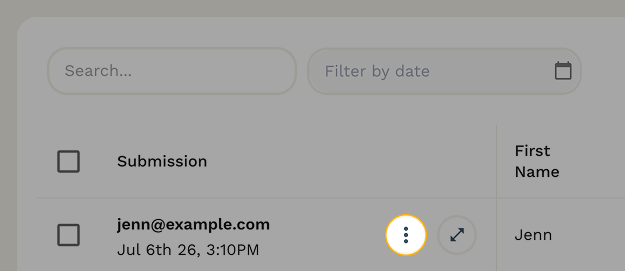
Additional Actions
In the first column, to the right of the submission data, you will see a two buttons that provide additional actions.
By clicking the three-dot menu, you can:
Download the submission as a PDF or Word document.
Download the Custom PDF associated with the submission.
Re-run integration actions.
Re-send webhooks.
Download all the files uploaded within that submission.
Copy a share link to the submission, which you can share with others in your team.
Delete the submission.
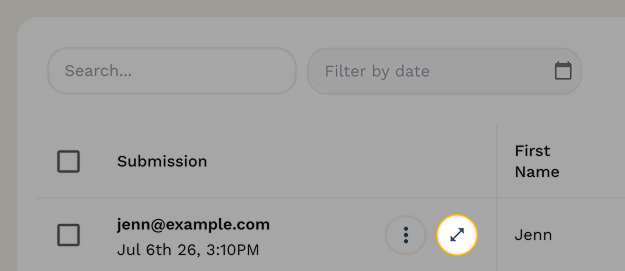
Single Submissions View
By clicking on the expand icon, you can view individual submissions per page.
The left and right arrows allow you to scroll through the submissions easily, one-at-a-time.
Exporting Submissions
You can export one or more submissions at a time using the checkbox to select your desired submissions. Submissions are exported as a CSV file.
Note: For exports that include a large number of submissions or a significant amount of uploaded content (e.g. file uploads, images, or signatures), a download link may be sent to your Paperform account email instead of opening immediately. This may take a few hours, depending on the number of exported submissions.
Partial Submissions
What is a Partial Submission?
This feature is exclusively available with selected pricing plans.
A Partial Submission is a record of when a respondent began answering questions on the form, but did not click the "Submit" button at the end of the form.
Partial Submissions aren't considered "complete" records of data; they lack certain pieces of information normally found in a regular submission. They do not include:
"Submitted At" Date and Time
Payment Total
PDF Summary
Each partial submission will instead include:
"Started At" Date and Time
Last answered question
Unlike a regular Submission, post-submission actions like emails and integrations are not triggered. This means that Partial Submissions cannot:
Send Custom Emails
Generate Custom PDFs
Trigger Integration Actions
Partial Submissions are kept for 30 days.
Partial submissions aren't considered "complete" records of data, and therefore we automatically purge new partial submissions after 30 days on a rolling basis.
Should you wish to keep your partial submissions past this rolling 30 day period, you'll need to export these manually via your Paperform dashboard. If you'd like to do this regularly, we offer support via our API to view data from your partial submissions on each form.
Products
Product Stock
Paperform allows you to see an overview of products Product fields on your form. You can locate the Products Overview by navigating to your Submissions dashboard, and then select "Products" from the sidebar.
Total Available Stock
This is the stock value entered for each product within your Paperform product field. This value will only change if it is updated in the field configuration in the form editor.
If no value is entered for stock, this will be shown as "Unlimited".
Remaining Stock
This value is the remaining stock when compared with the number of purchases for this product. When this value reaches 0, it will display "Out of Stock".
If no value is entered for stock, this will be shown as "Unlimited".
Please note that the remaining stock can't be displayed on your forms - an "Out of Stock" message will automatically be shown when a Product becomes unavailable, but the amount remaining cannot be displayed.
Allocated Stock
Allocated Stock is the amount of stock that has been purchased by respondents on your form.
Caution: Allocated stock can also be set manually. So, if you ever do set it manually, the allocated stock will not correspond to the exact amount of products purchased across all submissions for the form.
Modify Stock Levels
The "Total Available Stock" can be modified from within the form editor by changing the Stock property within the relevant product field's configuration. This is listed under the "Products" tab.
Reset Stock Levels
This option allows you to reset the "Allocated Stock" for a specific product. This can be useful if you sell products in batches, without the need to directly modify the form editor.
Analytics & Reporting
We offer all plans the opportunity to collect analytics with Paperform, however some features are restricted to selected pricing plans. All subscription plans have the ability to connect Paperform to Google Analytics, to learn more please see our guide here.
Exclusively available with selected pricing plans, Paperform offers built-in analytics and reporting features directly via your dashboard. With these plans, you also have the option to use your own analytics scripts by following our guide here.
With AI Insights, available on selected price plans, you can easily extract key information from your form submissions. This powerful feature analyzes your data and generates a customized report, giving you clear answers to your questions about your audience.
Reporting
Setting up your report
Paperform's built-in reporting feature offers insights into how respondents answered questions on your form.
Side Navigation Menu
In the Reports section, you'll find a list of your form's questions on the left side in the navigation menu.
Want to rearrange them? You can easily do this by clicking and dragging them into the order you prefer!
If you need to see more of the report and less of the navigation menu, you can always collapse it by clicking the “<” symbol on the upper-right hand side of the menu:
You can generate customized reports depending on your needs. When creating your report, you can:
Choose which questions are included in the report.
Filter responses by date range.
Create and compare segments of data.
To set up your reports, click on "New Report" to start from scratch, or click on an existing one across the top of the page.
Note that you can have multiple reports for one form. Simply select the "+" icon next to default report.
Choosing which questions are included in the report
You can remove any fields you don’t need in the report by clicking the three-dot menu next to the field title and then “Remove.”
You can also remove fields by clicking the Remove option on the right-hand side of the page next to the field name:
To re-add the question, just click Add Field and re-add the question that was removed:
Note: The Report Setup page also gives you a count of how many times each question was answered.
Text Blocks
You now have even more ways to customize your reports! Add rich text segments to name different sections, provide helpful context, or highlight ownership—making your reports clearer and more personalized.
You can do this by clicking one of the Add Text options next to your question:
Then typing what you want to appear in these areas:
Custom Labels
Want to customize the labels for certain questions in your report—without showing them to customers? Just click the gear icon next to the question title!
In the example below, we’ve updated the first two answers to highlight the best instructor for the class the respondent chose:
Filter responses by date range.
By default, all data is included in the report. You can filter responses by specifying a date range.
Segments
A segment is a group of responses that have been filtered with different rules. Click on the + icon to create new segments and save them. The segments that are visible will be compared in the report. To hide a segment, click the three dots next to the segment name and click "Hide."
Note: You may wish to segment your data by UTM parameters. To do this, you will need to capture those parameters using Hidden Fields. Learn more about capturing UTM parameters.
Note: If your form has built-in Scoring enabled, the minimum, maximum and average score for each segment is also displayed.
What's in the report?
Breakdown of responses by Question
Below t, you will find a breakdown of responses by individual question. Under each question in the reports section, there’s data regarding how many times it was answered, how many times it was skipped, and if applicable, an overall result.
Answered - This is the number of times a question was answered.
Skipped - This is the number of times the question was not answered.
Depending on whether the question contains fixed answers or user-inputted answers, what you see on the report will look a bit different.
Fixed-answer questions
Fixed answers or quantitative answers will summarize the data with a bar chart, along with the basic stats like how many questions were answered vs skipped. A breakdown of the answers by percentage is displayed in a table underneath.
Examples of question types with fixed answers:
Country
Dropdown
Matrix
Multiple choice
Product
Ranking
Rating
Scale
Slider
Subscription
Yes/No
If the options for a fixed-answer question change, such as when adjusting Multiple Choice question options, previous form submissions containing now-invalid answers are no longer counted in your report for those affected fields.
User-input questions
If the question requests input from the person filling out the form, it is a qualitative question. Included with these questions are the basic statistics of how many were answered vs. skipped. A "Details" tab will be available when accessing the report from the browser which will list each individual answer.
Note: The "Details" portion is not included in the print-ready version of the report, to avoid generating a potentially infinitely long list of answers. To print a copy of qualitative data, you will need to export your submissions as a CSV from the "Submissions" tab.
These types of questions are:
Text
URL
Email
Address
Color Picker
Date/Time
Image
Number
Phone number
Price
Signature
Note: We don’t currently support reporting for File Upload, Calculation, Hidden, or Appointment fields.
Exporting Your Report
If you'd like to export your Reports, click the three dots on the top right of the page. This will produce a printable version of the page for your browser.
Note: This print-ready version of the report excludes the "Details" portion of qualitative questions.
Sharing Your Report
Now that you've created a detailed report for your form results, you'll likely want to share it from time to time! To do that, just click the three-dot menu in the upper-right corner of the Reports page and select “Share.”
You'll see an option to enable sharing, along with a custom link you can share with anyone you choose.
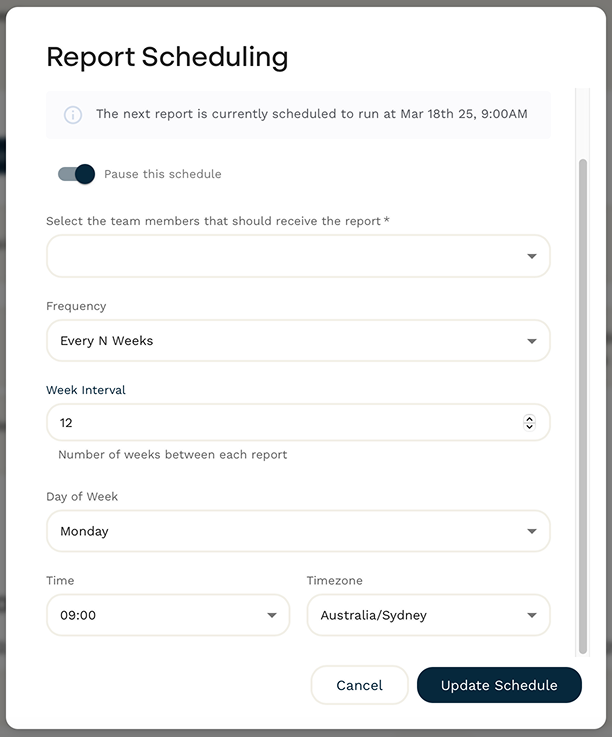
Scheduling
The Scheduling tool makes it easy to automate report deliveries to your team members on a daily, weekly, or monthly basis. Need to send reports at longer intervals? No problem! You can choose “Every N Weeks” under the frequency section, and set the exact number of weeks between each report.
The selected team member(s) will then be emailed a PDF copy of the report at the scheduled time. If you choose to, you can pause the schedule by toggling on the “Pause this schedule” button, and the reports will cease until you’re ready to start them back up again.
Note: Before sending your report, don’t forget to give it a name! The default name is "Default report," but you can easily change it by clicking the three-dot menu in the top right corner and selecting "Rename." This name will appear in the subject of the email when the report is sent.
Analytics
The Analytics dashboard offers a detailed look at how many people have submitted your form, using intuitive graphing to make data easy to understand. This feature is exclusively available with selected pricing plans.
Using Analytics
Filters
You can apply a number of filters to your results to help analyze data from your form. These include filtering by any of the following options:
Device Type
The type of device a respondent used to complete your form. You can sort by:
All Devices
Mobile Devices
Tablet Devices
Desktop Devices
This can be helpful for identifying where respondents are most likely to use your forms, based on the type of device used.
Date Range
The date range for viewing your form data. You can set this using the calendar presented by clicking the button shown below:
This can be helpful when generating your own reports for a specific date range or quarter of the year.
Comparison Date
This option allows you to add a set of data specified by a custom date range. This comparison data is shown on your graphs with a green line.
Y and X Axis
To fully customize your experience, the Y and X axis of the graphs can be modified using the controls in the upper right.
For the Y axis, you can choose from:
Views
The total number of views on your form.
Viewers
The number of unique viewers that have opened the form page.
Started
For the number of Views on your form, this is the volume of people who began completing fields on the form.
Submissions
The number of people who successfully submitted your form, using the submit button.
Completion rate
Of the number of people who started the form, this is the percentage rate of people who completed a successful submission.
Total sales live
This is the total value of any sales made on your form using a live payment integration, as opposed to a test account.
Total sales test
This is the total value of any sales made on your form using a test payment integration, as opposed to a live account.
For the X axis, you can sort by:
Hour
Day
Week
Month
Year
The blue line on the graph shows results for the date range you select, while the green line shows the results for the comparison you have selected.
The green line will not be visible on your graph if the comparison is set to "Nothing".
Exporting CSV
If you'd like to export your analytics as a .csv file, you can do so by clicking the "Export CSV" at the top-right of the page. This will automatically download a file with your analytics results matching the filters and date range selected.
Drop-off Questions
If you have Partial Submissions captured from your form, a section will appear below your analytics graphs labeled "Drop-off Questions".
This section will show which questions your respondents stopped answering your form on, which can provide a useful insight for your analytics.